Eliminating Non-Paleo Foods Improves Nutrient Density
Possibly the biggest criticism made against The Paleo Diet is that by eliminating multiple food groups (grains, dairy, legumes, and starchy roots) the diet can cause nutrient deficiencies.
In fact, this argument is a major reason why The Paleo Diet remains at the bottom of the US News and World Report’s Best Diet Rankings. In their rationale, US News stated “slapping the diet with multiple low ratings, the experts couldn’t accept that entire food groups, like dairy and grains, are excluded, making it hard for dieters to get all the nutrients they need.”

It was also an argument made by Connie Diekman, former president of the Academy of Nutrition and Dietetics in an article this spring.
It would be a very powerful argument against The Paleo Diet… if it wasn’t based on flawed logic.
And it doesn’t take a Ph.D. to find the flaw. In fact, anyone with a little time and a basic nutrition app can easily disprove it. All you have to do is compare the nutrient density of Paleo foods to non-Paleo foods. But since your time is precious and this is what we do, we put together the comparison ourselves in Table 1 below:
Table 1. Mean nutrient density of the major food groups. Table created by Loren Cordain, Ph.D. using Nutritionist Pro Software. Nutrient content of each food item was determined based on a 100 kcal sample. Percent of Dietary Reference Intake (DRI) values were summed to determine overall nutrient density of each group. Food groups are ranked from left to right based on their density. Food groups considered a healthy part of a Paleo diet are highlighted in green. Food groups that are not considered part of a Paleo diet are highlighted in red. See Appendix B for more details on the creation of this table.
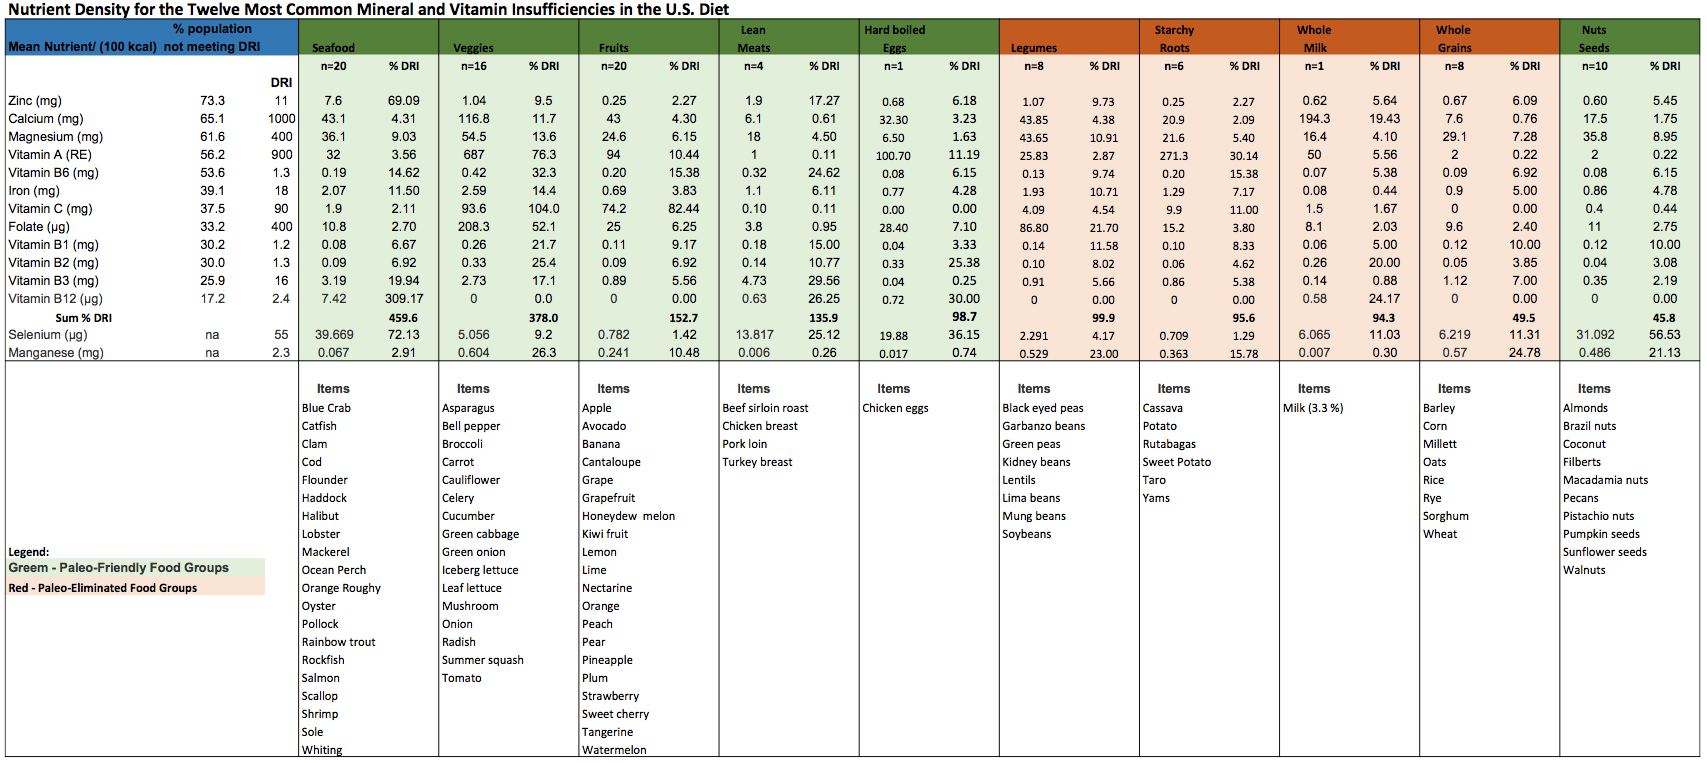
(Click here to download a PDF of this table)
The flaw in the criticism: The Paleo Diet doesn’t simply “eliminate” foods, it replaces them with more nutrient dense foods
The criticism claiming the Paleo diet makes it hard to get the nutrients we need would hold weight if the eliminated food groups contained nutrients we couldn’t get any other way, if they were highly nutrient dense (by calorie,) or if we simply eliminated food groups (like dairy and grains) without replacing them. Let’s use Table 1 to show why none of those three conditions apply to the Paleo diet.
First is the question of whether we eliminate foods we can’t get any other way? Table 1 shows the 12 most commonly deficient nutrients in the U.S. As you can see, all twelve nutrients can be found in abundance with only Paleo-friendly food groups.
This condition does exist however for vegetarians and vegans. Unfortunately, they can’t get sufficient nutrients like vitamin B12 when they eliminate animal-based foods.1-4 As a result, many vegan foods are fortified with vitamin B12.
The second question was whether the Paleo diet eliminates highly nutrient-dense foods making it hard to get our daily recommended intakes (DRIs)? As you can see from Table 1, the four food groups “eliminated” by the Paleo diet (grains, dairy, legumes, and starchy roots) are in fact very close to the bottom of the list in terms of nutrient density. We certainly aren’t eliminating nutrient-packed foods. To the contrary, it would actually be hard to hit our DRIs eating from non-Paleo food groups.
And that doesn’t tell the whole picture. Many of the common western foods eliminated by a Paleo diet are highly processed foods including refined sugars, refined grains, refined vegetable oils, refined fats, salt and preservatives. These foods are generally devoid of micronutrients and refined cereal grains have much of their already limited nutrients milled out.
Worse, both beans and whole grains contain high concentrations of phytates which significantly impair the absorption of minerals including calcium, zinc, magnesium, iron, selenium and manganese.5-12
What this means is that the food groups eliminated by the Paleo diet are not only very nutrient-poor (made worse by processing), they actually reduce absorption of the nutrients you do consume.
Finally, there’s the question of what we replace the eliminated food groups with? Of the three questions, this one truly reveals the fundamental flaw in the argument used by US News and other Paleo-critics. Their argument is based on the idea that we simply eliminate foods. But when calories from one food group are eliminated in your diet, you don’t just eat fewer calories. Those calories must be replaced with another food group.
With the exception of nuts (which we recommend eating sparingly,) the Paleo-friendly foods are more nutrient dense than non-Paleo foods (foods which we have already demonstrated to be nutrient-poor and full of nutrient-blocking phytates.) This makes it essentially impossible to “lose” nutrient density by replacing non-Paleo foods with Paleo-friendly foods.
In fact, contrary to what the critics say, a Paleo diet is necessarily denser and actually makes it easier to get the nutrients you need. It’s right there in red and green.
The devil is in the details: Two examples of replacing non-Paleo food groups
To help illustrate the point that replacing non-Paleo foods with Paleo-friendly foods will improves nutrient density, we compared sample one-day menus from several diets. We started with two diets considered to be healthy and nutrient dense by many in the nutrition world. The first was the Mediterranean diet (MED) which is ranked fourth by US News. The second was a Low-Fat/High-Carbohydrate (LF/HC) diet based on recommendations from the American Heart Association (AHA) to help prevent obesity and heart disease.13
To see what happens when the non-Paleo food groups are “replaced” in these two diets, we created matched Paleo menus. Meaning the Paleo menus were generated by eliminating the non-Paleo foods (grains, dairy, legumes and starchy roots) from the MED and LF/HC diets and replacing them with Paleo-friendly foods. In both cases we tried to match the menus for calories and macronutrient ratios.
Then we compared the menus for nutrient density.
The Sample Menus by the Numbers: Matched Paleo Menus Are Denser
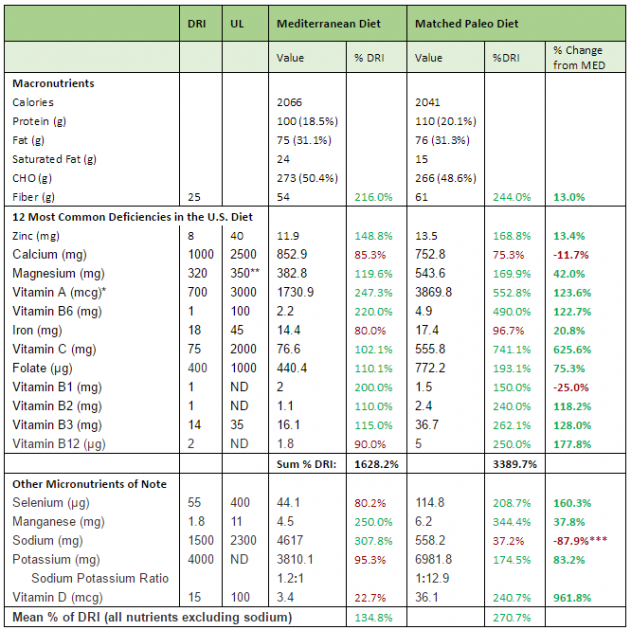
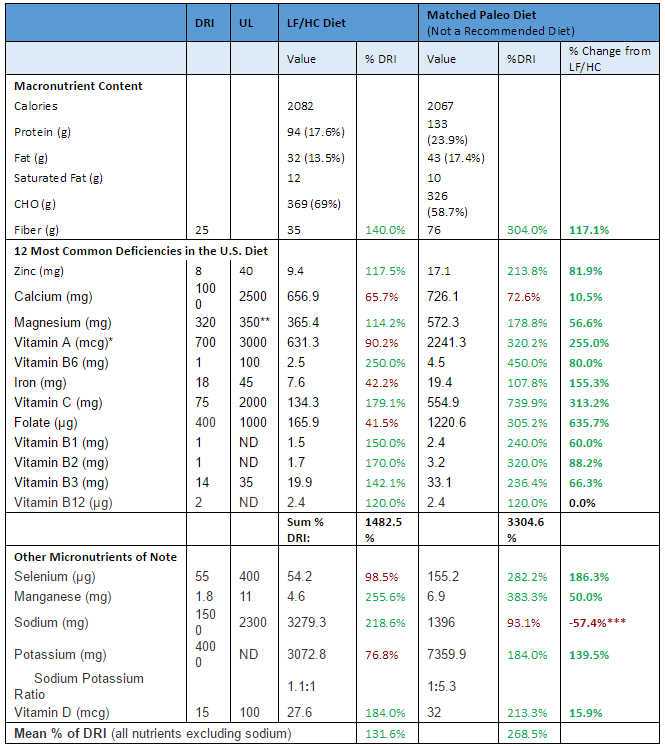
The nutrient break-down and overall density of the sample menus and the matched Paleo menus are shown in tables 2 and 3 below. The detailed menus can be found in Appendix A.
Table 2: Nutrient density comparison of a sample one-day Mediterranean menu and matched Paleo menu. The menu and Dietary Reference Intakes (DRIs) are based on a 31-50-year-old female consuming between 2,000 and 2,100 kcal per day. * UL as preformed vitamin A only ** Upper limit for supplemental magnesium *** The MED diet was too high in sodium, so the lower value of the matched Paleo menu is desirable
Conclusion – and those were “healthy” diets
Critics claim that by eliminating several food groups, the Paleo diet loses critical nutrient density. But in both examples above, the matched Paleo menu was twice as dense as both the Mediterranean diet and the low-fat/high carbohydrate diet based on percent DRI values.
Which is all the more staggering when you consider that these two mainstream diets are considered healthy nutrient-dense diets and they weren’t compared to an optimal Paleo diet. All we did was eliminate and replace non-Paleo foods.
But that, in a nut-shell, is the fundamental flaw in the argument that the Paleo diet is dangerously low in key nutrients. The diet doesn’t just “eliminate” nutrient-critical food groups as our detractors imply. The lost calories have to be replaced and the Paleo diet does this by replacing nutrient-poor foods with nutrient-rich foods. The result, necessarily, is a more nutrient dense diet.
Of course, in our comparison of the diets, the argument can be made that we just used one-day sample menus and that you have to be careful about drawing too many conclusions from a single day example. We even stated that ourselves and made the point that these are just examples. But we’ll throw this challenge out to you if you have a basic nutrition app and a little time – take any sample menu from the Mediterranean diet, LF/HC diet, or almost any other mainstream “healthy” diet. Then replace the non-Paleo foods with matched Paleo-friendly foods and see if you can create a lower nutrient density menu. Short of replacing everything with nuts, we feel pretty confident you’re going to end up wasting a lot of your valuable time.
Appendix: Sample Diets
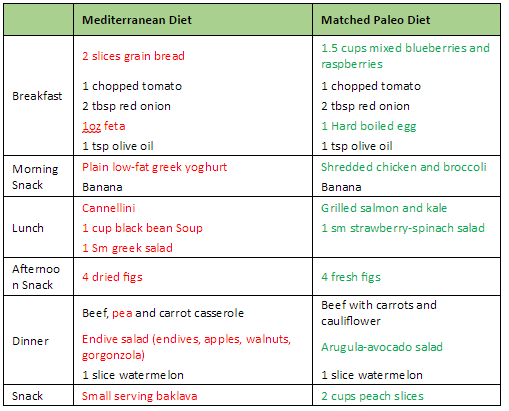
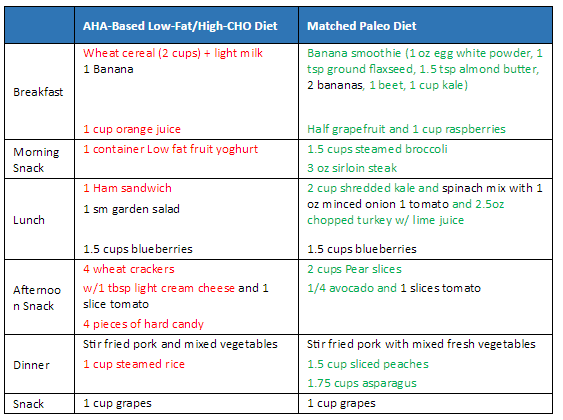
Tables 4 and 5 below show the sample diets used for both the Mediterranean and LF/HC diets alongside the matched Paleo-friendly diets. The sample menus were drawn directly from a recent randomized six-week cross-over study comparing the Mediterranean diet to the AHA-style Low-Fat/High-Carbohydrate diet.13
Food items highlighted in red are non-Paleo foods that were eliminated from the matched diet, while items highlighted in green are the replacement Paleo-friendly foods. Food items in black are considered part of both diets and included in both. Menus were matched as closely as possible for total calories and macronutrient ratios.
Food portions were based on a 31-50-year-old female consuming between 2,000 and 2,100 kcal per day.
Table 4: Sample one-day Mediterranean menu and matched Paleo meal plan. Non-paleo foods are highlighted in red while replacement foods are highlighted in green.
Appendix B: Key and Notes on Table 1.
All micronutrient (vitamin and mineral) data was derived from the USDA Standard Reference Database via the nutritional software, Nutritionist Pro. DRI values were obtained from The National Academies, Dietary Reference Intakes.20 When DRI values differed between genders, the highest value for 19-30-year-old adults was used to calculate % DRI for each micronutrient. All foods were separated into one of ten specific categories (whole grains, milk, fresh fruits, fresh non-starchy vegetables, fresh fish and seafood, fresh lean meats, nuts and seeds, legumes and beans, starchy root vegetables and eggs). Foods listed for each category represented the most frequently commonly consumed items in the U.S. diet. Values for individual micronutrients represent mean 100 kcal value for the entire category of foods. For instance, the zinc value (6.09 mg) for whole grains represents the average (mean) 100 kcal value for all whole grains (barley, corn, millet, oats, rice, rye, sorghum and wheat). The % DRI values were calculated by dividing the actual value; for example, zinc (0.67 mg) by the DRI (11 mg) for zinc times 100 = % DRI (6.09 %). All food category % DRI values were summed to obtain interval level data in order to compare the sum total micronutrient density for any food category. The most nutrient dense food categories in rank order are: [#1] seafood (sum score: 459.6), [#2] fresh vegetables (sum score: 378), [#3] fruits (sum score: 152.7), [#4] lean meats (sum score: 135.9), [#5] legumes (sum score: 99.9), [#6] eggs (sum score: 98.7), [#7] starchy roots (sum score: 95.6), [#8] whole milk (sum score: 94.3), [#9] whole grains (sum score: 49.5), [#10 nuts and seeds (sum score: 45.8). Micronutrient values for all food categories were also calculated for selenium and manganese but were not included in the sum total evaluation of each food category, as the percentage of the population lacking in these two micronutrients is not available.
References
[1] Are you getting enough of this vitamin? If you’re a vegetarian or over age 60, you need to be concerned about getting enough vitamin B12. Harv Health Lett, 2005. 30(10): p. 1-2.
[2] Plevrakis, P., Iron and vitamin B12 deficiency anaemia in a vegetarian. Dent Update, 2002. 29(10): p. 515.
[3] Weiss, R., Y. Fogelman, and M. Bennett, Severe vitamin B12 deficiency in an infant associated with a maternal deficiency and a strict vegetarian diet. J Pediatr Hematol Oncol, 2004. 26(4): p. 270-1.
[4] Close, G.C., Vegetarian diet and vitamin B12 deficiency. Eur J Pediatr, 1988. 147(3): p. 333.
[5] Saha, P.R., C.M. Weaver, and A.C. Mason, MINERAL BIOAVAILABILITY IN RATS FROM INTRINSICALLY LABELED WHOLE WHEAT-FLOUR OF VARIOUS PHYTATE LEVELS. Journal of Agricultural and Food Chemistry, 1994. 42(11): p. 2531-2535.
[6] Kadrabova, J., et al., SELENIUM STATUS, PLASMA ZINC, COPPER, AND MAGNESIUM IN VEGETARIANS. Biological Trace Element Research, 1995. 50(1): p. 13-24.
[7] Davidsson, L., et al., Manganese absorption in humans: the effect of phytic acid and ascorbic acid in soy formula. Am J Clin Nutr, 1995. 62(5): p. 984-7.
[8] Bohn, T., et al., Phytic acid added to white-wheat bread inhibits fractional apparent magnesium absorption in humans. Am J Clin Nutr, 2004. 79(3): p. 418-23.
[9] Hallberg, L., M. Brune, and L. Rossander, Iron absorption in man: ascorbic acid and dose-dependent inhibition by phytate. Am J Clin Nutr, 1989. 49(1): p. 140-4.
[10] Morris, V.C., et al., EFFECT OF SODIUM PHYTATE AND ALPHA-CELLULOSE ON SELENIUM (SE) BALANCE IN YOUNG MEN. Federation Proceedings, 1985. 44(5): p. 1670-1670.
[11] Sandstrom, B., et al., Effect of inositol hexaphosphate on retention of zinc and calcium from the human colon. Eur J Clin Nutr, 1990. 44(10): p. 705-8.
[12] Pallauf, J., M. Pietsch, and G. Rimbach, Dietary phytate reduces magnesium bioavailability in growing rats. Nutrition Research, 1998. 18(6): p. 1029-1037.
[13] Ryan, M.C., et al., The Mediterranean diet improves hepatic steatosis and insulin sensitivity in individuals with non-alcoholic fatty liver disease. J Hepatol, 2013. 59(1): p. 138-43.
[14] Kotchen, T.A., A.W. Cowley, Jr., and E.D. Frohlich, Salt in health and disease–a delicate balance. N Engl J Med, 2013. 368(13): p. 1229-37.
[15] Whelton, P.K., et al., Sodium, blood pressure, and cardiovascular disease: further evidence supporting the American Heart Association sodium reduction recommendations. Circulation, 2012. 126(24): p. 2880-9.
[16] Karppanen, H. and E. Mervaala, Sodium intake and hypertension. Prog Cardiovasc Dis, 2006. 49(2): p. 59-75.
[17] Aaron, K.J. and P.W. Sanders, Role of dietary salt and potassium intake in cardiovascular health and disease: a review of the evidence. Mayo Clin Proc, 2013. 88(9): p. 987-95.
[18] D’Elia, L., et al., Habitual salt intake and risk of gastric cancer: a meta-analysis of prospective studies. Clin Nutr, 2012. 31(4): p. 489-98.
[19] Cordain, L., et al., Origins and evolution of the Western diet: health implications for the 21st century. Am J Clin Nutr, 2005. 81(2): p. 341-54.
[20] Academies, T.N., Dietary Reference Intakes for Calcium, Phosphorous, Magnesium, Vitamin D, and Fluoride (1997); Dietary Reference Intakes for Thiamin, Riboflavin, Niacin, Vitamin B6, Folate, Vitamin B12, Pantothenic Acid, Biotin, and Choline (1998); Dietary Reference Intakes for Vitamin C, Vitamin E, Selenium, and Carotenoids (2000); and Dietary Reference Intakes for Vitamin A, Vitamin K, Arsenic, Boron, Chromium, Copper, Iodine, Iron, Manganese, Molybdenum, Nickel, Silicon, Vanadium, and Zinc (2001).
Learn About the Diet


The Paleo Diet® Newsletter
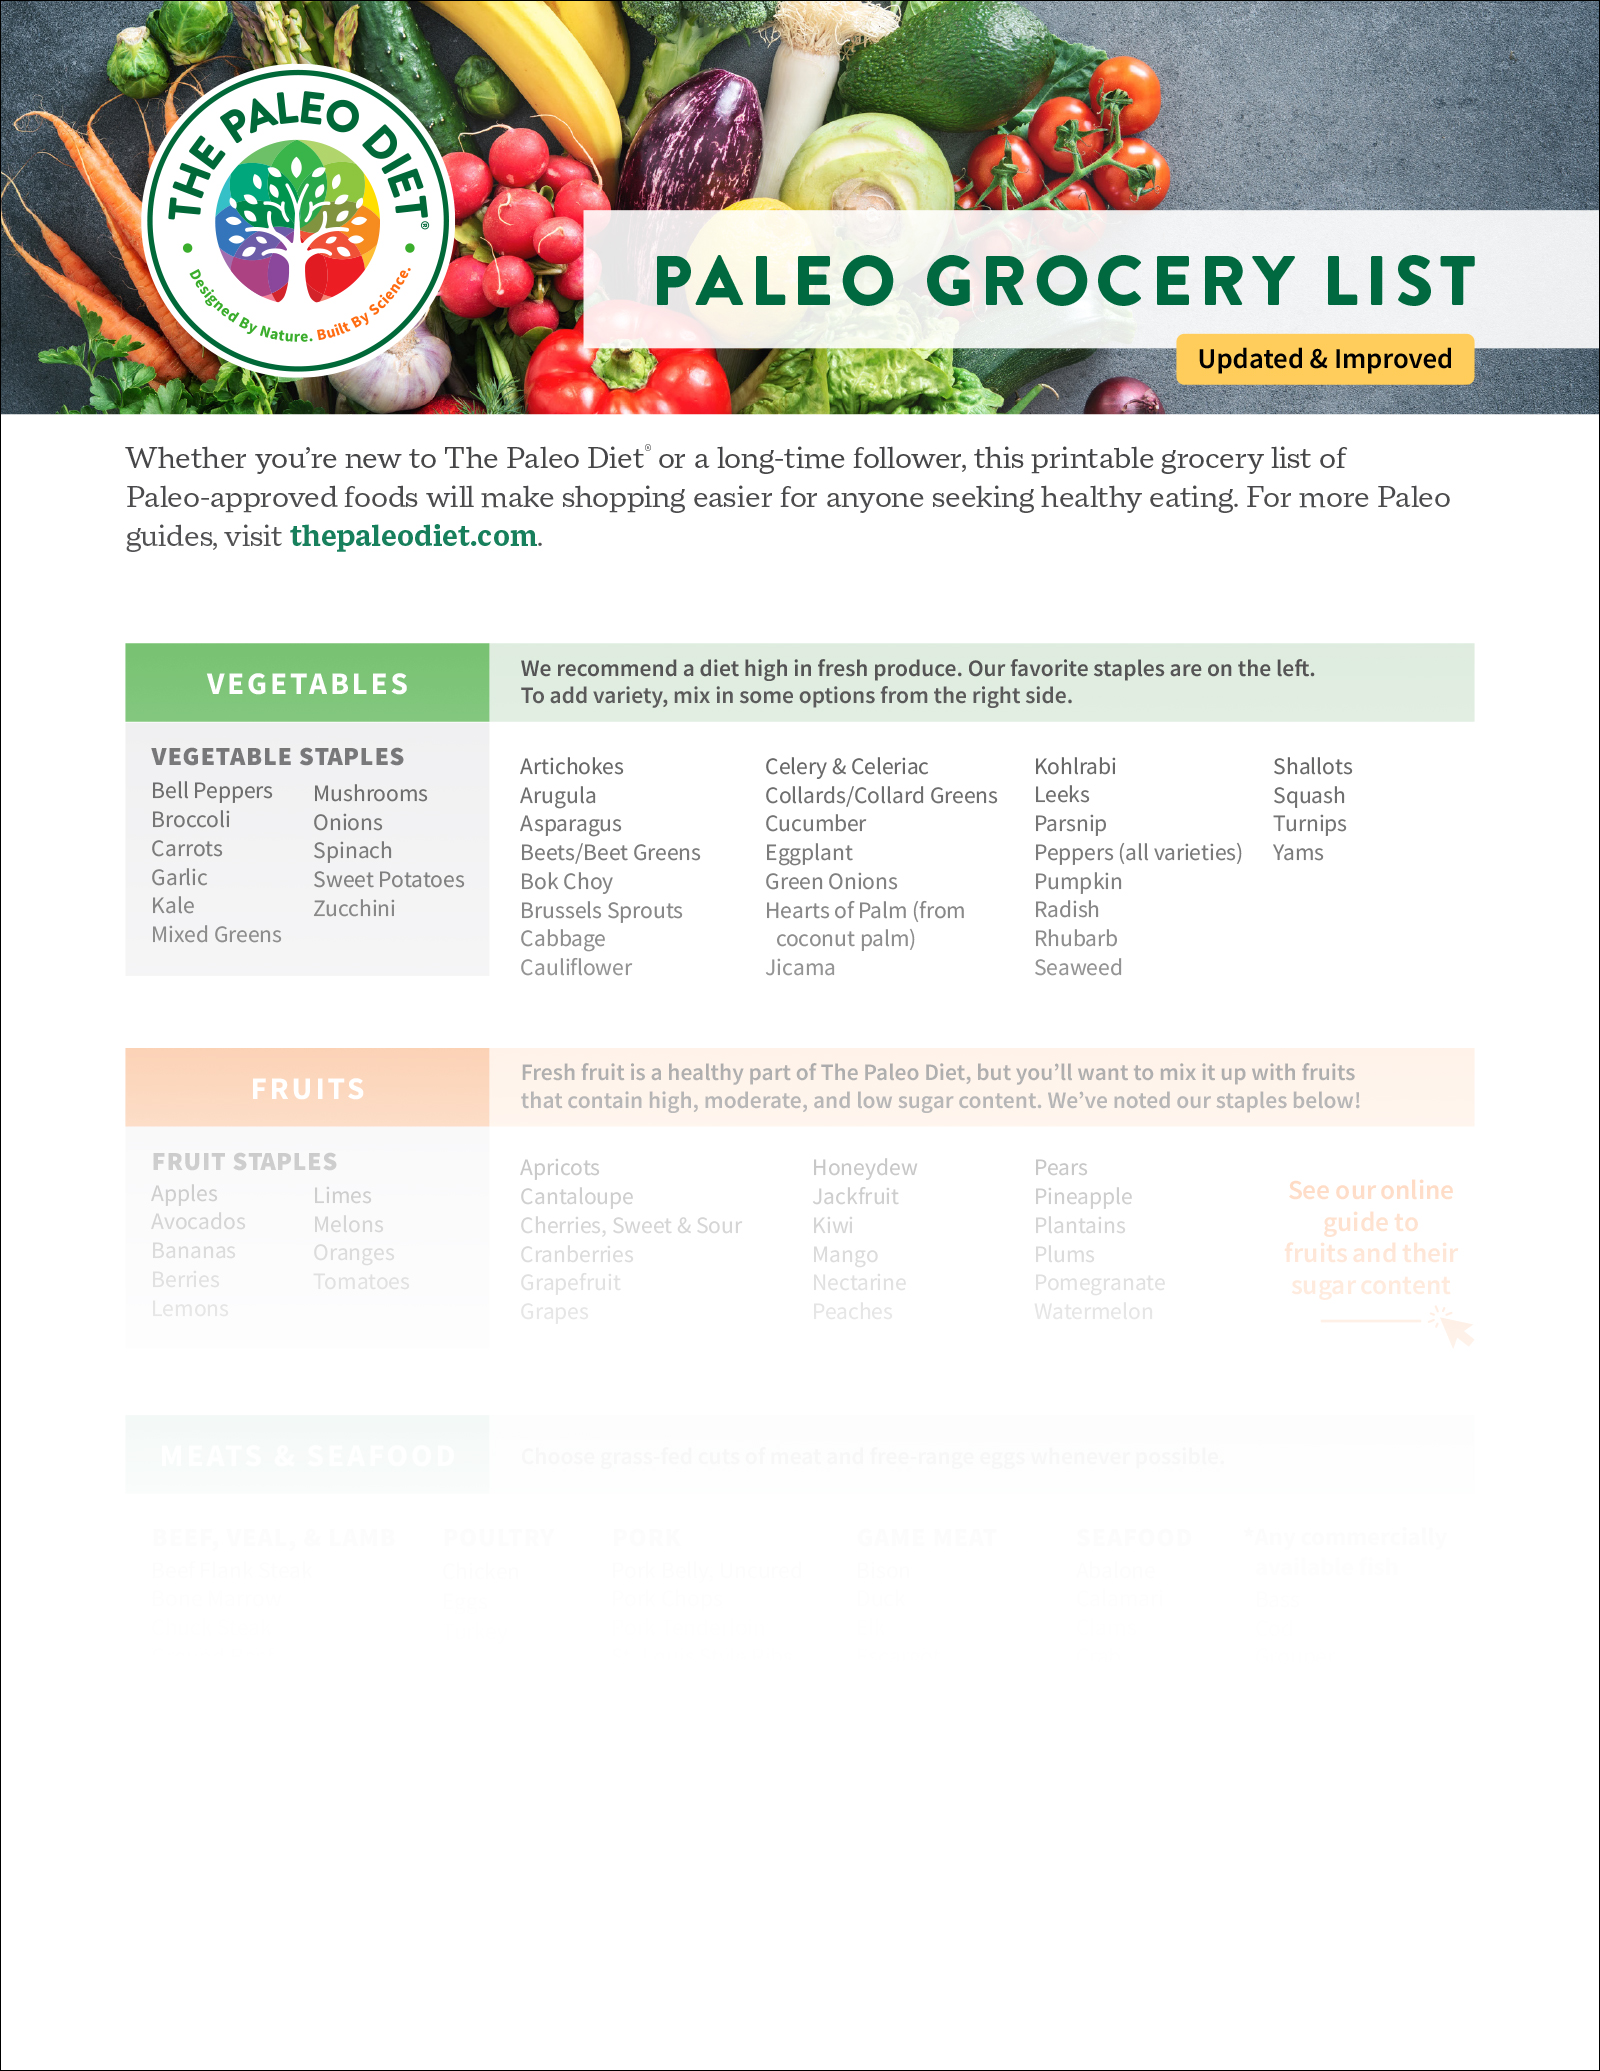
Sign up to get info on healthy nutrition, free recipes, meal prepping, and the latest health research. New subscribers will also receive our Official Paleo Grocery List!