Keto Side Effects: Long-Term Nutritional Deficiencies and Metabolic Impact

Ketogenic diets can help ease a wide range of ailments, like epilepsy and potentially even suppressing cancer. However, going keto does not seem like a good long-term strategy for health and vitality.
Ketosis is clearly something that our ancestors were exposed to intermittently, but this does not mean that following a ketogenic diet is appropriate for a healthy individual, particularly for an extended period of time. To that end, it is important to understand the nutritional consequences of following a ketogenic diet over the long term, to put in check some of the excitement that can be generated by short-term benefits.
Recent research finds thyroid malfunction in patients receiving a one-year ketogenic diet due to intractable epilepsy, an easily avoidable consequence for a healthy individual. Further, it is critical to understand the difference between applying this dietary approach to a potentially terminal disease, such as cancer, and an easily reversible condition such as metabolic syndrome.
Here are some of the nutritional shortcomings of following a ketogenic diet over an extended period of time.
When Did Keto First Become Popular?
As a young man at age 21, I read Dr. Atkins’ bestselling diet book (Dr. Atkins’ Diet Revolution: The High Calorie Way to Stay Thin Forever) (1). Dr. Atkins’ bestseller was not the first book to advocate ketogenic diets for weight loss, but it was the first one to widely popularize the concept in the U.S. and elsewhere.
In the ensuing 46 years since Dr. Atkins published his book, public interest in ketogenic diets has periodically waxed and waned. Despite the public’s acceptance of ketogenic diets, the scientific lessons learned (over the past 46 years) about the adverse nutritional and metabolic effects of ketogenic diets have been left out of the spotlight.(2)
What Is a Ketogenic Diet?
Ketogenic diets, also known as very-low-carbohydrate-ketogenic diets (VLCKD), limit carbohydrate (CHO) intake to less than 50 grams (g) per day (3, 4).
In obese subjects, in patients with type 2 diabetes or metabolic syndrome, both short- and long-term (< 2 to 5 yrs.) ketogenic diets have proved to be effective in promoting weight loss, improving glucose and insulin metabolism, and reducing cardiovascular disease (CVD) symptoms (3, 5-12). In this regard, VLCKD can be viewed as therapeutic since they help to reduce symptoms of potential, life-threatening diseases. Nevertheless, The Paleo Diet also accomplishes these same health goals (13-22) but without the detrimental long-term nutritional and metabolic effects elicited by ketogenic diets.
Beyond inducing ketosis by drastically limiting CHO consumption (3, 4), few objective nutritional guidelines for designing and evaluating the nutritional adequacy of contemporary ketogenic diets currently exist. Accordingly, millions of healthy people in the U.S. without symptoms of CVD or the metabolic syndrome are now following ketogenic diets. Notice that ketogenic diet menu plans published in bestselling books and at popular websites conveniently omit nutrient analyses of daily, weekly and monthly meal plans.
Because contemporary ketogenic diets typically limit carbohydrates to between 25-50 g, this dietary restriction drastically limits your daily consumption of fresh fruits and vegetables. Eating just one banana (27 g CHO) or a single baked sweet potato (37 g CHO) would blow a 25 g CHO limit. An apple gives you 25 grams of CHO, and a single baked potato provides 36.6 grams of CHO. OK, you get my point, fresh fruits are drastically limited on ketogenic diets, as are unrestricted amounts of fresh vegetables (3, 4). By default, ketogenic diets are mainly composed of animal fats and proteins along with very small quantities of carbohydrates (< 50 g or < 200 kcal) from plant foods. Typical macronutrient energy values advocated by proponents of the ketogenic diet (2) are as follows: 65-75% energy from fats, 15-25% energy from protein and 5-10% energy from carbohydrates.
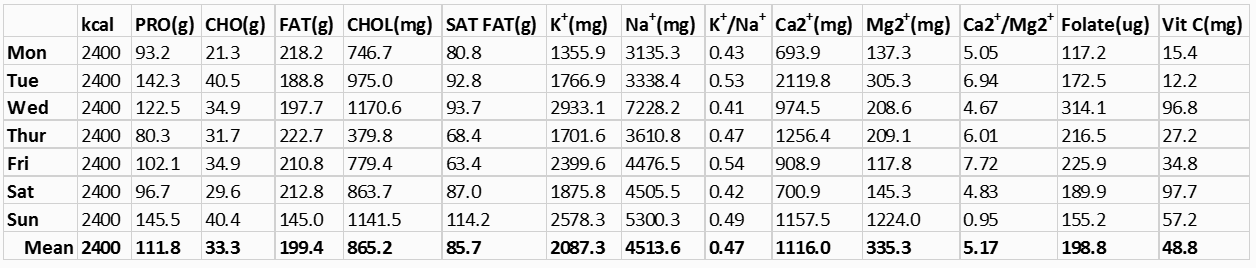
If you have never viewed the nutrient composition in a typical ketogenic diet, let me introduce you to some facts which may shock you. You can easily perform this simple experiment by yourself, if you have access to dietary analysis software. I use Nutritionist Pro software (23). The following nutrient analysis was generated by inputting all daily foods (breakfast, lunch, dinner and snacks) into Nutritionist Pro (23) for a typical 14-day keto diet menu plan created by a highly visible on-line blogger (2). Note that I have only included the first week of the 14-day menu plan, as the second week is similar to the first. All values were calculated for an adult male consuming his normal energy requirement of 2400 kcal/day (24). Table 1 includes only the deficient and health compromising nutrients which this VLCKD produces. Table 2 below lists the U.S. dietary reference intakes (DRI) (25) and dietary guidelines (26) for the various nutrients in Table 1.

Keto Diet Nutritional Breakdown
Macronutrients (carbohydrate, fat, and protein)
You can see that this 7-day meal plan is truly a very-low-carbohydrate-ketogenic-diet (VLCKD) with an average daily CHO intake of 33.3 grams (133.2 kcal or 5.6% energy) with a weekly range of 21.3 to 40.5 g/day of CHO. Contrast these numbers to the daily U.S. government recommended DRI (130 g) for carbohydrates (25). As fully expected, fat comprises the bulk of the average daily energy (74.8%) in this diet, while protein rounds out the remaining mean daily calories with 18.6% of the energy. Note that 1 g of CHO and protein = 4 kcal, and 1 g fat = 9 kcal.
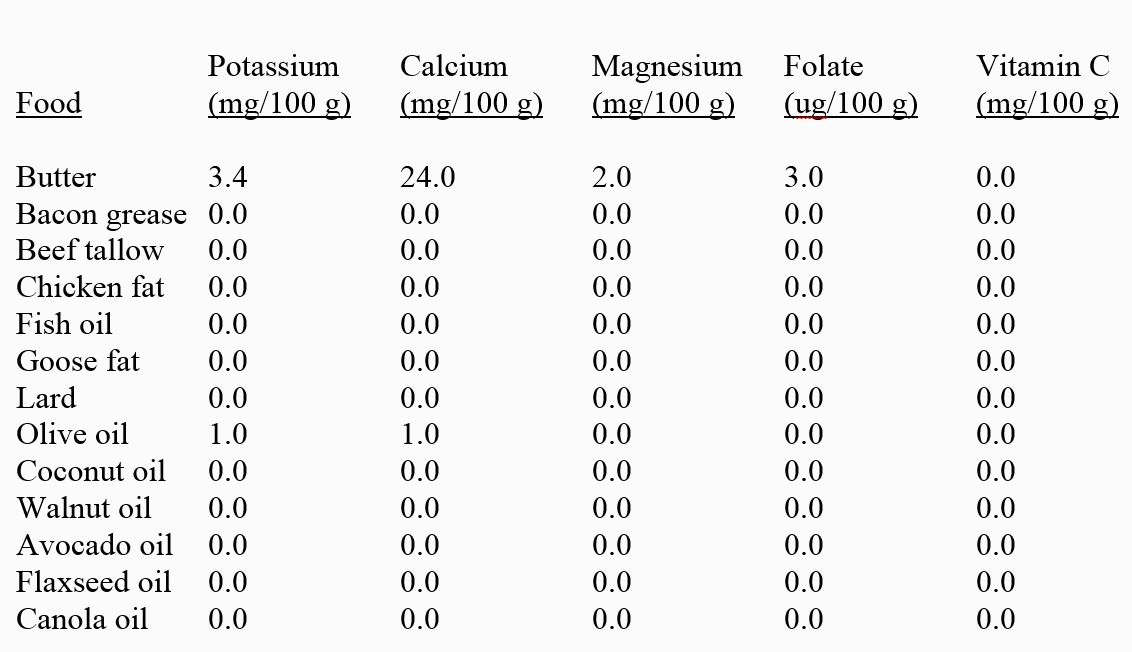
Without a doubt, the fat content (74.8% energy) of this VLCKD lies far beyond the U.S. recommended range for daily fat (20 to 35% energy) (25). Because both animal and refined plant fats are virtually devoid of potassium, calcium, magnesium, folate, and vitamin C (Table 3 below), it becomes difficult or nearly impossible to design extremely high-fat, VLCKD that are not deficient in one or more of these essential nutrients. Hence, the mandatory inclusion of high amounts (65 to 75% energy) of nutrient depleted fats in VLCKD, displaces foods rich in these nutrients, particularly fruits and vegetables. In addition, the CHO limit (25-50 g or 100-200 kcal) required by VLCKD further restricts consumption of fruits and vegetables which are rich dietary sources of potassium, calcium, magnesium, folate and vitamin C (27). Consequently, the vitamin and mineral deficiencies identified in Tables 1 and 2 from VLCKD are not surprising, but rather expected.
In addition to the human, self-imposed CHO limit of 25 to 50 g with VLCKD, it is important to mention that a physiologically determined limit to protein ingestion exists that will influence the design and implementation of all ketogenic diets. It appears that many promoters of VLCKD (2) are unaware of this physiological protein ceiling. As my research group has previously pointed out, maximal isocaloric protein intake is governed by the finite ability of the liver to up-regulate enzymes necessary for urea synthesis in the face of increasing protein ingestion (28). Hence, the maximal rate of liver urea synthesis determines the physiological protein ceiling in humans (28, 29). We have previously shown that the maximal range for dietary protein intake represents 29.7 to 40.9% (mean = 35.1%) of daily, isocaloric energy (28). Accordingly, the estimated mean maximal protein ceiling for the example in Table 1 would be 211 g of protein or 842 kcal of protein. My point here is to demonstrate that incorporation of more nutrient dense animal protein into VLCKD cannot resolve the nutrient deficiencies produced by high fat, ketogenic diets because protein consumption is limited by the physiological protein ceiling. The simplest solution to solve this nutritional dilemma would be to eat more fresh fruits and vegetables, as recommended in the Paleo Diet. Unfortunately, the self-imposed CHO limit of 25 to 50 g dictated by VLCKD make this solution difficult or impossible.
Potassium
As you can see from Tables 1 and 2, typical VLCKD cause a daily deficiency of potassium. In Table 1, the average daily potassium intake for the one-week menu plan is 2087 mg which is 2.3 times lower than the U.S. recommended value of 4700 mg. This result is not surprising because of the high fat content (65-75% energy) of VLCKD and the virtual absence of potassium in both animal and refined plant fats (Table 3). Together with the severe restriction of CHO (25-50 g) mandatory in VLCKD, potassium-rich fruits and vegetables (27) are thereby limited, further making a bad situation (low potassium intake) even worse. It is no surprise that VLCKD is nearly universally deficient in potassium.
While dietary potassium deficiency receives little attention in the popular press, potassium represents one of the four major shortfall nutrients in the U.S. diet, according to the 2010 Dietary Guidelines for Americans’ Advisory Committee (30). The average U.S. potassium intake (2591 mg/day) represents a significant dietary deficiency in itself (31), yet it is still better than the grossly deficient level (2087 mg/day) of potassium found in typical VLCKD diets (Table 1). Adequate dietary potassium is crucial for the prevention of cardiovascular disease (CVD) including the risk of stroke (31-33), high blood pressure (31, 34, 35), coronary heart disease (31, 34), and CVD morbidity (disease incidence) and mortality (death) (34). Sufficient potassium intake may also reduce the risk for osteoporosis and improve bone health (31) while simultaneously reducing all-cause cancer risk and incidence (36, 37).
Sodium
From Table 1, it is obvious that typical VLCKD maintain exceedingly high, average daily sodium (Na+) intakes (4517 mg) that represent almost twice the U.S. recommended value of 2300 mg (25). Why is this? Why do VLCKD maintain such dangerously high sodium intakes that increase your risk for cardiovascular disease, cancer, osteoporosis, kidney disease and other pathologies (31-43)? It has to do with achieving the artificially determined low CHO content (25-50 g) of VLCKD while simultaneously attempting to meet dietary calcium requirements.
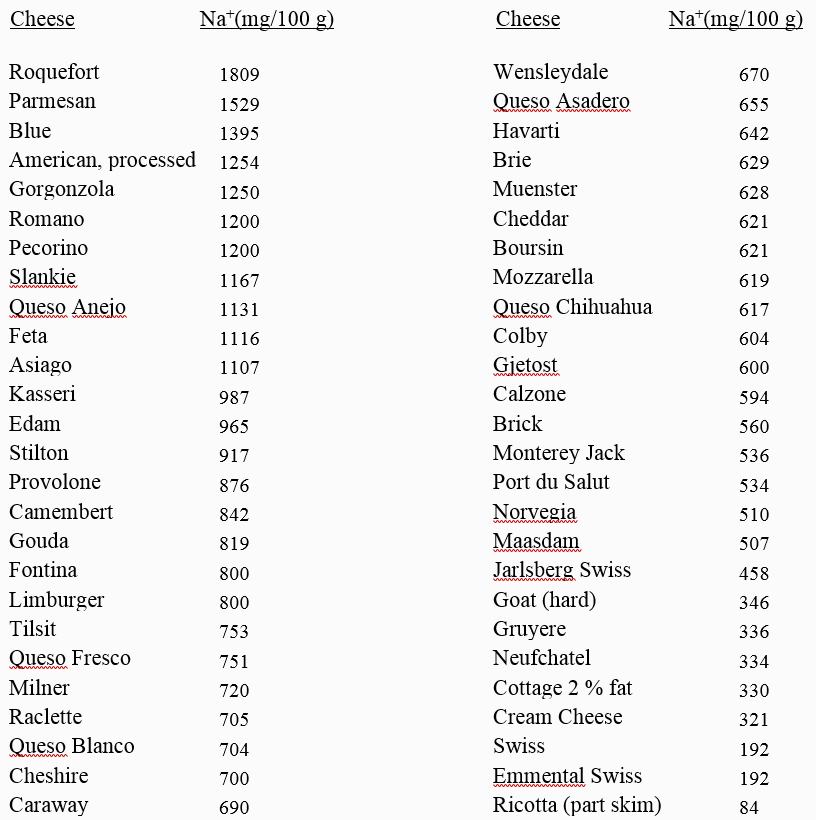
Unless VLCKD diets include dairy products (milk, yogurt, cheese) in their daily menus, it is difficult or impossible to meet the DRI (1000 mg) for calcium, simply because animal and plant fats which represent the bulk of energy (65-75%) in VLCKD contain virtually no calcium (Table 3). Without ridiculously high amounts of daily leafy green vegetables, all VLCKD will cause calcium deficiencies unless dairy products are consumed. Unfortunately, except for cheese, most dairy products (like whole milk and yogurt) contain excessive CHO for the restricted CHO limits of VLCKD. Whole milk (8 oz. or 1 cup) for instance yields 11.7 g of CHO and 278 mg of calcium. If you drink two glasses of milk, you have nearly reached your 25 g limit of CHO, but have barely achieved half (556 mg) of your 1000 mg calcium requirement.
In order to stay within the 25-50 g CHO limit imposed by VLCKD, yet still achieve the calcium DRI (1000 mg), it is necessary to include substantial amounts of cheese in ketogenic diets. Unfortunately, cheese represents a concentrated source of sodium along with its high calcium content. Table 4 below demonstrates the high levels of sodium in cheese.
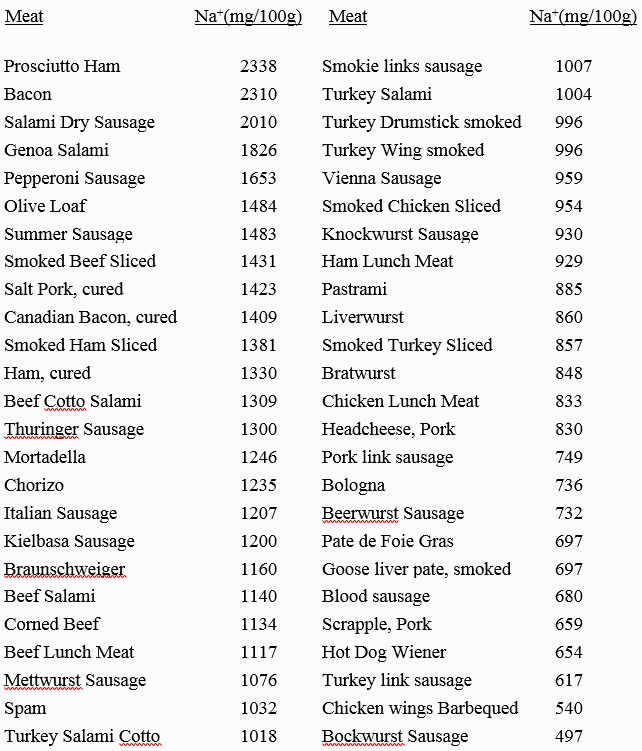
But it is not just cheese that produces the high sodium content in VLCKD. Many ketogenic bloggers also encourage the consumption of highly salted processed meats (bacon, salami, sausages etc.) and salted butter (714 mg Na+/100 g). Table 5 below demonstrates that processed meats represent a highly concentrated source of sodium, similar to cheeses. Note that bacon, a staple of VLCKD, contains the second highest sodium content of all processed meats. Sea salt, a darling of VLCKD recipes, also maintains a very high sodium concentration similar to table salt, and both are almost universally added to recipes and menus in VLCKD. Further, extra discretionary table salt is not discouraged in VLCKD. All of these factors contribute to the enormously high sodium load present in nearly all VLCKD.
Potassium and sodium interactions
Dietary potassium (K+) and sodium (Na+) are similar to Chinese YinYang philosophy, in which seemingly opposite forces are interconnected and complementary. In human nutrition, the dietary K+/Na+ ratio maintains a huge effect on our health and wellbeing. The higher the dietary K+/Na+ ratio, the healthier we are; the lower the ratio, the greater we are at risk for cardiovascular disease, cancer, osteoporosis, kidney disease, and other pathologies (31-43). VLCKD not only simultaneously induce dietary potassium deficiencies, but they almost always increase dietary Na+ intake (Table 1). These actions reduce the K+/Na+ ratio to 0.47 (Table 1) which is even lower than the current U.S. value of 0.76 (44), 4.3 times lower than recommended values of 2.0 (Table 2), and even 10 times lower than the estimated K+/Na+ ratios of > 5.0 in human ancestral human diets (43).
With contemporary Paleo Diets (45-47), you won’t have to worry about the K+/Na ratio because real Paleo Diets don’t contain added salt, and allow you unlimited consumption of fresh fruits and vegetables (45-47). These guidelines ensure that your K+/Na ratio will be > 5.0 similar to our hunter-gatherer ancestors (43, 48, 49).
High protein, potassium deficient VLCKD cause metabolic acidosis
From Tables 1 and 2, you can clearly see that typical VLCKD not only cause potassium deficiencies, but they are also extremely high in animal protein amounting to 112 g/day on average, which is twice as high than the U.S. DRI (25, 26) for an adult male consuming 2400 kcal. Higher animal protein diets without adequate alkaline base (potassium bicarbonate) from fruits and vegetables produce a net metabolic acidosis (51, 52).
Acid/base balance in your body
All foods that you ingest and assimilate eventually report to your kidneys as either acid, base (alkaline) or neutral (51, 52). Animal proteins are metabolized into acidic residues, mainly sulfuric acid, and fruit and vegetables are metabolized into alkaline residues, mainly potassium bicarbonate (53). Table 6 below demonstrates that virtually all meats, fish, eggs, cereal grains, legumes, cheeses and dairy foods produce a net acid load to the kidneys that is referred to as the potential renal acid load (PRAL) (51) or the net endogenous acid production (NEAP) (52).
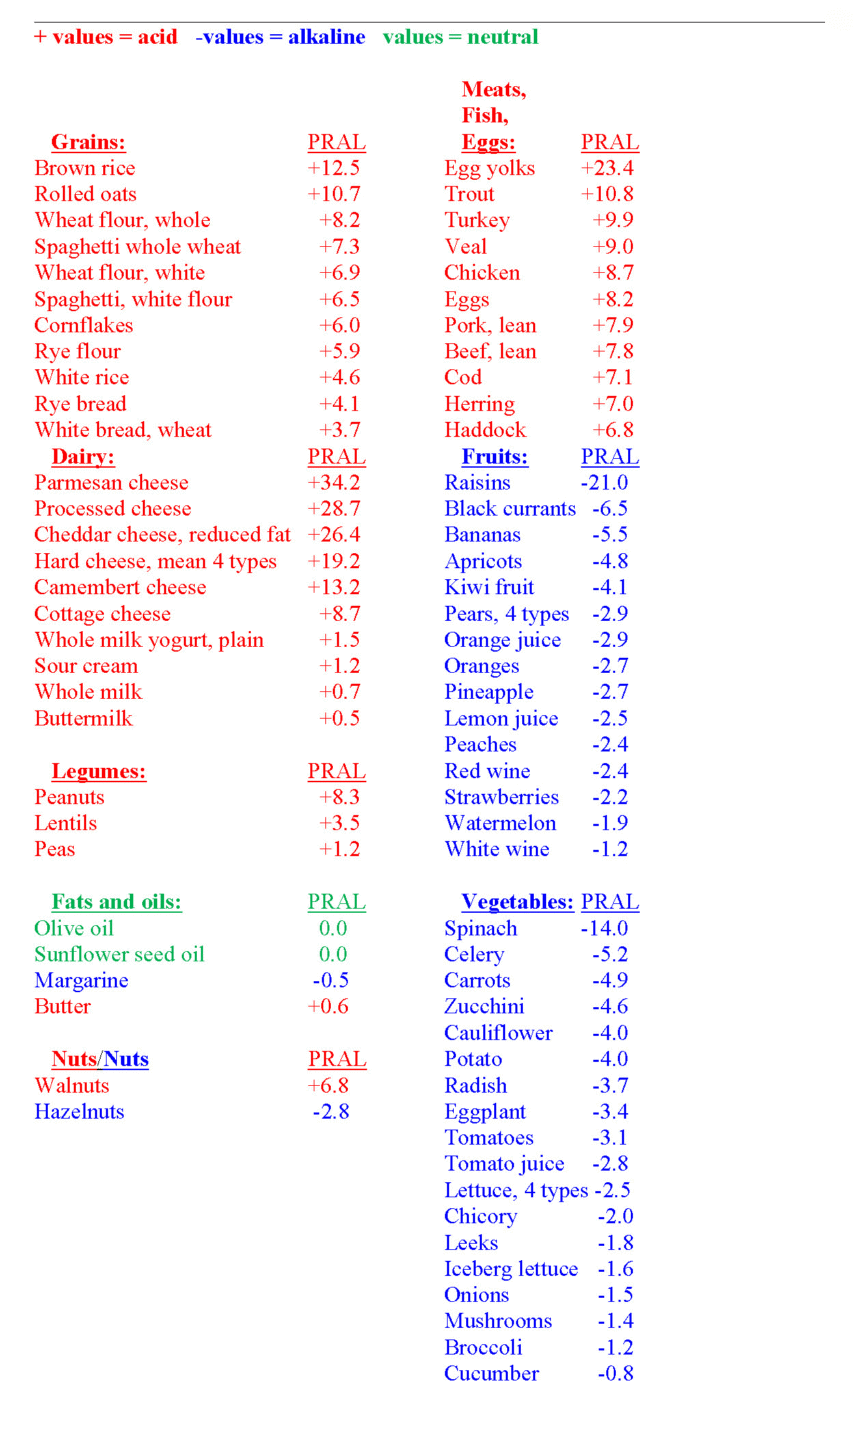
As you can see from Table 6, fruits and vegetables (almost exclusively) yield a net base (alkaline) load to the kidneys. Since merely 12.2% of U.S. adults consume the recommended daily 1.5-2 cups of fruits and 2-3 cups of vegetables (54), the typical American diet is net acid producing, generating 75-100 mEq of acid per day (55). Hence, VLCKD, which limit fruit and vegetable consumption even further than the typical American diet, make an already bad situation (a net acid yielding diet) even worse.
Dietary potential renal acid loads (PRAL) and net endogenous acid productions (NEAP) can easily be calculated for any meal or any recipe by inserting nutrient values (protein and potassium) or (protein, potassium, phosphorus, magnesium and calcium) into the following three multiple regression equations:
- Estimated NEAP (mEq·day−1) = (0.91 × protein (g·day−1)) − (0.57 × potassium (mEq·day−1)) + 21 (52)
- Estimated NEAP (mEq·day−1) = (54.5 × protein (g·day−1)/potassium (mEq·day−1)) − 10.2 (52)
- Estimated NEAP (mEq·day−1) = Potential Renal Acid Load (PRAL) (mEq·day−1) + Estimated Urinary Organic Anions (OAest) (56). PRAL is calculated as: (mEq·day−1) = 0.488 × protein (g·day−1) + 0.037 × phosphorous (mg·day−1) − 0.021 × potassium (mg·day−1) – 0.026 × magnesium (mg·day−1) – 0.013 × calcium (mg·day−1), whereby: OAest (mEq·day−1) = (0.007184 × height 0.725 × mass 0.425) × (41/1.73) (53).
A recent study evaluating VLCKD in elite athletes (n=24) demonstrated that after 21 days, the experimental ketogenic diet resulted in a significantly higher estimated NEAP in treatment subjects compared to controls consuming a high-carbohydrate diet (57). Evaluation of the one week VLCKD in Table 1 revealed that the weekly average meal generated a net acid production of 114.1 mEq/day which is 14% to 52% higher (worse) than the average American diet (75-100 mEq/day) (55).
Metabolic consequences of net metabolic acidosis
It’s no scientific secret—VLCKD, because of their potassium deficiency and high protein content, induce a net metabolic acidosis (51, 52, 57, 58). Unless blood pH is measured from arterial blood (not venous or capillary blood), respiration confounds blood pH assessments thereby making venous and capillary blood pH measurements of VLCKD uninterpretable (59). Hence, all studies which evaluated blood acidity (pH) in VLCKD using venous or capillary blood are invalid (57, 60). The few studies (58) of arterial blood measurements in subjects following VLCKD consumption demonstrate a significantly (p=0.007) decreased plasma pH (e.g. increased acidity).
Now, the essential question is this: What are the metabolic consequences of a VLCKD, net acid-producing diet over: 1) the short term [< 1 yr.], 2) the midterm [2-5 yrs.] or 3) a lifetime?
Over the short term, there is little argument in the scientific community that net acid producing diets increase urinary calcium loss (calciuresis) (50, 61-65) while simultaneously inducing increased protein breakdown from muscle (otherwise known as muscle wasting) (53, 66-69). In the short term, in healthy, normal, young subjects the metabolic shortcomings of VLCKD appear to not adversely affect bone health (70, 71), likely because of enhanced gut calcium absorption and reduced kidney calcium loss (70, 71).
The effects of long-term muscle protein losses from VLCKD are less clear. Muscle wasting appears to be an adaptive response to systemic acidosis (53). With muscle breakdown, amino acids are released into the blood which provide a substrate for liver synthesis of glutamine, which is used by the kidneys to synthesize ammonia. Ammonia molecules accept protons and are excreted as ammonium ions, thereby removing protons and alleviating acidosis (53).
Over the course of human lifetimes, the available evidence suggests that VLCKD don’t fare so well regarding bone health and osteoporosis. I doubt that any living person in the U.S. has strictly followed Dr. Atkins VLCKD recommendations since the publication of his popular book in 1972 (1). Nevertheless, at least one human population (the Inuit) living in far northern latitudes (> 60 ° North latitude) had no choice but to consume VLCKD for most of their lives prior to western acculturation (72). More than 20 years ago, my deceased scientific colleague and dear friend Staffan Lindeberg, M.D., Ph.D., pointed out (73) that the indigenous peoples of Northern Alaska and Canada maintained bone densities which were, “generally low compared to U.S. Whites (74-77), and bone loss starts at an earlier age and proceeds at a greater rate than in other populations. I am not aware of any scientific paper which claims the opposite.”
High-sodium diets and bone health
High salt (NaCl) diets including VLCKD (Table 1) may promote bone loss because of their high sodium content in addition to the net metabolic acidosis they impose on bone. It has been well established that high sodium intakes increase calcium loss in the urine (calciuresis) (78-81). A review of 23 human studies examining sodium induced calciuresis concluded: “that for every 100 mmol of sodium excreted in the urine, there is approximately 1 mmol loss of urinary calcium in free-living normocalciuric healthy populations.” (78). A recent meta-analysis involving 39,065 subjects demonstrated that higher sodium consumption significantly increased the risk for osteoporosis in pre-menopausal women and also in women older than 50 years of age (82). The adverse effects of high salt diets on bone are particularly evident in post-menopausal women (80, 81, 83-86), but likely occur in all human populations, including males, as we age (85).
Of course, as you already know, contemporary Paleo Diets do not include any added salt (45-49) in any recipe or meal plan. Consequently, you don’t have to worry about the adverse effects of high salt diets, including VLCKD, on your bone health.
Magnesium deficiency
Table 1 demonstrates that the typical VLCKD currently being promoted on line and in popular books induce magnesium deficiency. The DRI for magnesium is 400 mg/day (Table 2), whereas Table 1 shows that characteristic VLCKD menu plans only provide an average daily magnesium intake of 335 mg. As was the case with potassium, the primary reason for magnesium deficiency is from the high (65% to 75% energy) fat content of VLCKD. You can see from Table 3, both animal fats and refined vegetable fats contain virtually no magnesium. Hence the displacement of magnesium containing foods by magnesium empty fats, in high fat VLCKD encourages magnesium deficiencies. Long-term magnesium deficiencies are definitely not good for your health, and increase the risk for stroke (87), kidney dysfunction (88), premature aging (89), cardiovascular disease (90), all-cause mortality (death), cancer (91), hypertension and type 2 diabetes (92).
Magnesium and calcium interactions
Just like the dietary K+/Na+ ratio, the dietary calcium to magnesium ratio (Ca2+/Mg2+) retains a Ying/Yang relationship in which seemingly opposite forces are interconnected and complementary. In human nutrition, the dietary Ca2+/Mg2+ ratio maintains a huge effect upon our health and well-being. Ca2+/Mg2+ ratios of less than 1.7 and greater than 2.8 are detrimental to health and well-being (93). The dietary analysis of a typical VLCKD (Table 1), shows a Ca2+/Mg2+ ratio of 5.2 which is almost two times higher than recommended limits of 2.8 (93) or recommended healthful values of 2.0 (93, 94). High dietary values for the Ca2+/Mg2+ ratio such as those produced by typical ketogenic diets (Table 1) may increase the risk for cardiovascular disease, particularly from increased artery calcification (95-98). Typical ketogenic diets cause Ca2+/Mg2+ imbalances because of their dependence upon high levels of dietary fat (65% to 75% energy) which is virtually devoid of Mg2+ (Table 3) and by including large amounts of calcium rich cheese that provide an average Ca2+/Mg2+ ratio of 22.5 (27), further increasing the dietary imbalance between calcium and magnesium.
Folate deficiencies
The DRI for folate is 400 µg/day (Table 2). Hence, all 7 days of the weekly VLCKD dietary plan (Table 1) are deficient in folate, and the daily average intake for folate (199 µg/day) only contains 50% of the DRI recommended value (25).
The folate deficiency produced by VLCKD is not surprising at all given that folate is virtually absent in the animal and refined plant fats (Table 3) that comprise 65-75% of the calories in VLCKD. Further the CHO limit (< 25-50 g) imposed by VLCKD, prevent unlimited consumption of folate rich, fresh fruits and vegetables (27).
Although consumption of liver represents a good dietary source of folate, many people find the taste of liver less than agreeable, so it is rarely or never included in VLCKD menu plans. Leafy green vegetables are also a good source of folate. Although the most folate dense leafy greens (spinach, 194 µg folate/100 g; turnip greens,194 µg folate/100 g; mustard greens 187 µg folate/100 g and parsley, 152 µg folate/100 g) are not necessarily excluded from VLCKD recipes and menus, it is difficult to persuade ketogenic dieters to eat more than 100 g (~1/4 lb.) of leafy greens daily, which many people find bitter or unpleasant tasting. Even if you manage to eat 100 g (~1/4 lb.) of leafy greens while on your VLCKD, you still only obtain about half (194 mg) of the recommended DRI for folate (400 µg).
Folate deficiencies, which are commonly produced by very-low-carbohydrate-ketogenic diets (Table 1), are responsible for numerous human health problems over the short term as well as over lifetimes, including increased risk for coronary heart disease (99, 100), stroke (101, 102), all cancers (103), pancreatic cancer (104), cervical cancer (105), folate deficiency neuropathies (106), folate deficiency anemia (102), and neural tube defects (spina bifida) in the fetuses of pregnant women (107).
Because contemporary Paleo Diets encourage consumption of fresh fruits and vegetables as well as liver and organ meats (45-47), they yield high daily intakes (891µg/day) of folate that represent 2.3 times the required DRI (48). If you decide to undertake a VLCKD, it is likely that a folate deficiency will occur, in addition to deficiencies of potassium, magnesium and vitamin C (Table 1).
Vitamin C deficiency
The adult DRI for vitamin C is 90 mg/day. From Table 1, you can see that VLCKD typically come up short for vitamin C, as the daily average intake of vitamin C is merely 48.8 mg. On only two days of the week do typical VLCKD) meet the recommended vitamin C requirement (Table 1). We all have heard about 15th and 16th century sailors developing scurvy on long ocean voyages, but who would have ever expected that ketogenic diets could lead to vitamin C deficiencies.
As with most essential dietary nutrients, the adverse effects of vitamin C deficiencies may manifest themselves in the short term, but also over the course of a lifetime. Epidemiological evidence reveals that in industrialized countries, 5% of the population are vitamin C deficient while 13% maintain a suboptimal status (108). Further, deficient or suboptimal blood concentrations of vitamin C are associated with negative health outcomes including scurvy, coronary heart disease, stroke and cancer (108). However, there is no evidence that vitamin C supplementation reduces all-cause mortality, cardiovascular disease or cancers (108). Hence, the take home message is this: Get your vitamin C naturally from fresh fruits and vegetables—not from supplements!
Because VLCKD may produce vitamin C deficiencies over a 7-day period (Table 1), it is likely that this nutrient pattern (vitamin C deficiency) could repeat itself over weeks, months and years if typical VLCKD are not modified to increase foods rich in vitamin C.
I have previously shown you how VLCKD may impair bone health and may promote osteoporosis (particularly as we age), via their high net acid loads and their high salt content. A recent meta-analysis demonstrated that greater dietary vitamin C intake was associated with a reduced risk of hip fracture and osteoporosis, as well as higher bone mineral densities at the femoral neck and lumbar spine (109). The results of another 2018 meta-analysis involving 10,807 subjects concluded, “the results of the current meta-analysis strongly support that increasing dietary vitamin C intake can decrease the risk of hip fracture.” (110). Accordingly, the low intake of vitamin C in VLCKD (Table 1) may represent another additive risk factor in promoting harmful bone mineral health over the course of a lifetime.
In addition to positively influencing bone mineral health, meta-analyses indicate that higher intakes of vitamin C may also be protective against esophageal cancer (111), lung cancer (112) and may reduce breast cancer mortality (113) while also reducing the risk of stroke (114). Again, the important message here is to increase your vitamin C intake naturally through your diet by eating more fresh fruits and vegetables.
As you know by now, the reason why VLCKD may induce vitamin C deficiencies (Table 1) is their restriction of fresh fruits and vegetables. In contrast The Paleo Diet encourages you to eat all the fresh fruits and vegetables you desire (45-47). Nutritional analyses (48) of The Paleo Diet shows it to provide a whopping 748 mg of vitamin C per day, which is 8.3 times more than the DRI—all of this without vitamin C supplements.
Comparisons of The Real Paleo Diet to Ketogenic Diets
It is important here to note, that The Paleo Diet in question does not include processed meats, dairy products, or Paleo “desserts” made from honey, maple syrup, molasses, nut flours and refined vegetables oils. The contemporary Paleo Diet that I, Boyd Eaton, Staffan Lindeberg, Jennie Brand-Miller, Neil Mann, John Speth, Tony Sebastian, and other scientists envisioned in the late 1990s and have written extensively about since do not include these later popularized foods due to their insufficient nutritional characters and technological limitations of our hunter-gather ancestors.
Regardless of the distinction, this “real” Paleo Diet still varies greatly from VLCKD.
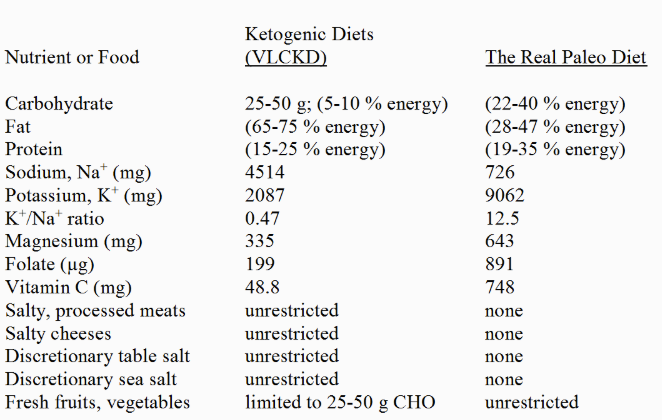
Table 7. Nutritional Comparison of The Real Paleo Diet (45-47) to Ketogenic Diets (VLCKD)
Typical VLCKD (Table 1) result in nutrient deficiencies for potassium, magnesium, folate and vitamin C while allowing for supra-physiologic sodium intakes. In review, these nutrient shortcomings occur for the following reasons: 1) fat intakes in VLCKD represent 65-75% of total energy, and fats are virtually devoid of potassium, magnesium, folate and vitamin C. Accordingly, nutrient depleted fats displace foods which have higher concentrations of these nutrients, thereby increasing the risk for these nutrient deficiencies, 2) fresh fruits and vegetables, which are rich sources of potassium, magnesium, folate and vitamin C (27), are limited in VLCKD to 25-50 g CHO/day; accordingly this restriction acts synergistically with the high fat content of VLCKD to produce these nutrient deficiencies, 3) VLCKD permit unrestricted consumption of high-salt, processed meats and cheeses which elevate dietary sodium intakes to exceedingly high levels. High sodium intakes combined with the potassium depleted fats of VLCKD as well as fruit and vegetable restrictions produce extremely low K+/Na+ ratios, 4) unrestricted cheese consumption in VLCKD together with low magnesium intakes produces an exceptionally high Ca2+/Mg2+ ratio, 5) the virtual lack of folate or vitamin C in animal or plant fats (which comprise 65-75%) of the daily energy in VLCKD together with the restriction on fresh fruits and vegetables encourages the deficiency of these two vitamins.
Summary
VLCKD may produce therapeutic and beneficial health effects in the short term (3,4), particularly for epilepsy patients (115). In obese subjects, in patients with type 2 diabetes or the metabolic syndrome, both short and long term (2 to 5 years) ketogenic diets have proved to be effective in promoting weight loss, improving glucose and insulin metabolism and reducing cardiovascular disease (CVD) symptoms (3-12). In this regard VLCKD can be viewed as therapeutic since they help to reduce symptoms of potential, life-threatening diseases.
Nevertheless, The Paleo Diet (45-47) also accomplishes these same health goals (13-22) but without the detrimental long-term nutritional and metabolic effects elicited by ketogenic diets. Amazingly, few objective nutritional guidelines for designing and evaluating the nutritional adequacy of contemporary ketogenic diets currently exist. Accordingly, millions of healthy people in the U.S. without symptoms of CVD or the metabolic syndrome are now recklessly following ketogenic diets. So, consumers beware of very-low-carbohydrate-ketogenic diets (VLCKD)!
References
- Atkins RC. Dr Atkins’ Diet Revolution: The High Calorie Way to Stay Thin Forever. D. McKay Co: New York, NY, USA, 1972.
- https://thepaleodiet.com/charismatic-paleo-bloggers-rigorous-caution-required/
- Paoli A, Rubini A, Volek JS, Grimaldi KA. Beyond weight loss: a review of the therapeutic uses of very-low-carbohydrate (ketogenic) diets. Eur J Clin Nutr. 2013 Aug;67(8):789-96.
- Veech RL. The therapeutic implications of ketone bodies: The effects of ketone bodies in pathological conditions: ketosis, ketogenic diet, redox states, insulin resistance, and mitochondrial metabolism. Prostaglandins Leukot Essent Fatty Acids 2004; 70: 309–319.
- Cicero AF1, Benelli M2, Brancaleoni M3, Dainelli G3, Merlini D3, Negri R3. Middle and long-term impact of a very low-carbohydrate ketogenic diet on cardiometabolic factors: A multi-center, cross-sectional, clinical study. High Blood Press Cardiovasc Prev. 2015 Dec;22(4):389-94.
- Clifton PM, Condo D, Keogh JB. Long term weight maintenance after advice to consume low carbohydrate, higher protein diets–a systematic review and meta-analysis. Nutr Metab Cardiovasc Dis. 2014 Mar;24(3):224-35.
- Hussain TA, Mathew TC, Dashti AA, Asfar S, Al-Zaid N, Dashti HM. Effect of low-calorie versus low-carbohydrate ketogenic diet in type 2 diabetes. Nutrition. 2012 Oct;28(10):1016-21.
- Sargrad KR, Homko C, Mozzoli M, Boden G. Effect of high protein vs high carbohydrate intake on insulin sensitivity, body weight, hemoglobin A1c, and blood pressure in patients with type 2 diabetes mellitus. J Am Diet Assoc. 2005 Apr;105(4):573-80.
- Nordmann AJ, Nordmann A, Briel M, Keller U, Yancy WS Jr, Brehm BJ, Bucher HC. Effects of low-carbohydrate vs low-fat diets on weight loss and cardiovascular risk factors: a meta-analysis of randomized controlled trials. Arch Intern Med. 2006 Feb 13;166(3):285-93.
- Hession M, Rolland C, Kulkarni U, Wise A, Broom J. Systematic review of randomized controlled trials of low-carbohydrate vs. low-fat/low-calorie diets in the management of obesity and its comorbidities. Obes Rev. 2009 Jan;10(1):36-50.
- Castañeda-González LM, Bacardí Gascón M, Jiménez Cruz A. Effects of low carbohydrate diets on weight and glycemic control among type 2 diabetes individuals: a systemic review of RCT greater than 12 weeks. Nutr Hosp. 2011 Nov-Dec;26(6):1270-6.
- Bueno NB, de Melo IS, de Oliveira SL, da Rocha Ataide T. Very-low-carbohydrate ketogenic diet v. low-fat diet for long-term weight loss: a meta-analysis of randomised controlled trials. Br J Nutr. 2013 Oct;110(7):1178-87.
- Lindeberg S, Jönsson T, Granfeldt Y, Borgstrand E, Soffman J, Sjöström K, Ahrén B. A Palaeolithic diet improves glucose tolerance more than a Mediterranean-like diet in individuals with ischaemic heart disease. Diabetologia 2007, 50(9):1795-1807.
- Osterdahl M, Kocturk T, Koochek A, Wandell PE: Effects of a short-term intervention with a Paleolithic diet in healthy volunteers. Eur J Clin Nutr 2008, 62(5):682-685.
- Frassetto LA, Schloetter M, Mietus-Synder M, Morris RC Jr, Sebastian A. Metabolic and physiologic improvements from consuming a Paleolithic, hunter-gatherer type diet. Eur J Clin Nutr 2009. Aug;63(8):947-55
- Jönsson T, Granfeldt Y, Ahrén B, Branell UC, Pålsson G, Hansson A, Söderström M, Lindeberg S. Beneficial effects of a Paleolithic diet on cardiovascular risk factors in type 2 diabetes: a randomized cross-over pilot study. Cardiovasc Diabetol. 2009;8:35 doi: 10.1186/1475-2840-8-35
- Boers I, Muskiet FA, Berkelaar E, Schut E, Penders R, Hoenderdos K, Wichers HJ, Jong MC. Favourable effects of consuming a Palaeolithic-type diet on characteristics of the metabolic syndrom. A randomized controlled pilot-study. Lipids Health Dis. 2014 Oct 11;13:160.
- Mellberg C, Sandberg S, Ryberg M, Eriksson M, Brage S, Larsson C, Olsson T, Lindahl B. Long-term effects of a Palaeolithic-type diet in obese postmenopausal women: a 2-year randomized trial. Eur J Clin Nutr. 2014 Mar;68(3):350-7.
- Manheimer EW, van Zuuren EJ, Fedorowicz Z, Pijl H. Paleolithic nutrition for metabolic syndrome: systematic review and meta-analysis. Am J Clin Nutr. 2015 Oct;102(4):922-32.
- Pastore RL, Brooks JT1, Carbone JW2. et al. Paleolithic nutrition improves plasma lipid concentrations of hypercholesterolemic adults to a greater extent than traditional heart-healthy dietary recommendations. Nutr Res. 2015; 35:474-479.
- Masharani U, Sherchan P, Schloetter M, Stratford S, Xiao A, Sebastian A, Nolte Kennedy M, Frassetto L. Metabolic and physiologic effects from consuming a hunter-gatherer (Paleolithic)-type diet in type 2 diabetes. Eur J Clin Nutr. 2015 Aug;69(8):944-8.
- Otten J, Stomby A, Waling M, Isaksson A, Tellström A, Lundin-Olsson L, Brage S, Ryberg M, Svensson M, Olsson T. Effects of a Paleolithic diet with and without supervised exercise on fat mass, insulin sensitivity, and glycemic control: a randomized controlled trial in individuals with type 2 diabetes. Diabetes Metab Res Rev. 2016 May 27. doi: 10.1002/dmrr.2828. [Epub ahead of print]
- Nutritionist Pro, Nutritional Software. Axxya Systems. http://www.nutritionistpro.com/
- https://health.gov/dietaryguidelines/2015/guidelines/appendix-2/
- https://ods.od.nih.gov/Health_Information/Dietary_Reference_Intakes.aspx
- https://health.gov/dietaryguidelines/dga2000/document/choose.htm
- https://ndb.nal.usda.gov/ndb/nutrients/index
- Cordain L, Miller JB, Eaton SB, Mann N, Holt SH, Speth JD. Plant-animal subsistence ratios and macronutrient energy estimations in worldwide hunter-gatherer diets. Am J Clin Nutr. 2000 Mar;71(3):682-92.
- Rudman D, DiFulco TJ, Galambos JT, Smith RB, Salam AA, Warren WD. Maximal rates of excretion and synthesis of urea in normal and cirrhotic subjects. J Clin Invest 1973;52:2241–9.
- Dietary Guidelines Advisory Committee. Report of the Dietary Guidelines Advisory Committee on the Dietary Guidelines for Americans, 2010. Washington, DC: U.S. Department of Agriculture, Agricultural Research Sevice, 2011.
- Weaver CM. Potassium and health. Adv Nutr. 2013 May 1;4(3):368S-77S.
- Vinceti M, Filippini T, Crippa A, de Sesmaisons A, Wise LA, Orsini N. Meta-analysis of potassium intake and the risk of stroke. J Am Heart Assoc. 2016 Oct 6;5(10). pii: e004210
- Larsson SC, Orsini N, Wolk A. Dietary potassium intake and risk of stroke: a dose-response meta-analysis of prospective studies. Stroke. 2011 Oct;42(10):2746-50
- Aaron KJ, Sanders PW.Role of dietary salt and potassium intake in cardiovascular health and disease: a review of the evidence. Mayo Clin Proc. 2013 Sep;88(9):987-95
- Houston MC. The importance of potassium in managing hypertension. Curr Hypertens Rep. 2011 Aug;13(4):309-17.
- Jansson B. Geographic cancer risk and intracellular potassium/sodium ratios. Cancer Detect Prev. 1986;9(3-4):171-94
- Jansson B. Potassium, sodium, and cancer: a review. J Environ Pathol Toxicol Oncol. 1996;15(2-4):65-73
- Judd SE, Aaron KJ, Letter AJ, Muntner P, Jenny NS, Campbell RC, Kabagambe EK, Levitan EB, Levine DA, Shikany JM, Safford M, Lackland DT. High sodium:potassium intake ratio increases the risk for all-cause mortality: the Reasons for Geographic and Racial Differences in Stroke (REGARDS) study. J Nutr Sci. 2013 Apr 23;2:e13. doi: 10.1017/jns.2013.4.
- Umesawa M Iso H, Date C, Yamamoto A, Toyoshima H, Watanabe Y, Kikuchi S, Koizumi A, Kondo T, Inaba Y, Tanabe N, Tamakoshi A; JACC Study Group. Relations between dietary sodium and potassium intakes and mortality from cardiovascular disease: The Japan Collaborative Cohort Study for Evaluation of Cancer Risks. Am J Clin Nutr. 2008 Jul;88(1):195-202.
- Jackson SL, Cogswell ME, Zhao L, Terry AL, Wang CY, Wright J, Coleman King SM, Bowman B, Chen TC, Merritt R, Loria CM. Association between urinary sodium and potassium excretion and blood pressure among adults in the United States: National Health and Nutrition Examination Survey, 2014.Circulation. 2018 Jan 16;137(3):237-246
- Okayama A, Okuda N, Miura K, Okamura T, Hayakawa T, Akasaka H, Ohnishi H, Saitoh S, Arai Y, Kiyohara Y, Takashima N, Yoshita K, Fujiyoshi A, Zaid M, Ohkubo T, Ueshima H; NIPPON DATA80 Research Group. Dietary sodium-to-potassium ratio as a risk factor for stroke, cardiovascular disease and all-cause mortality in Japan: the NIPPON DATA80 cohort study. BMJ Open. 2016 Jul 13;6(7):e011632. doi: 10.1136/bmjopen-2016-011632
- Willey J, Gardener H, Cespedes S, Cheung YK, Sacco RL, Elkind MSV. Dietary sodium to potassium ratio and risk of stroke in a multiethnic urban population: The Northern Manhattan Study. Stroke. 2017 Nov;48(11):2979-2983.
- Frassetto L, Morris RC Jr, Sellmeyer DE, Todd K, Sebastian A. Diet, evolution and aging–the pathophysiologic effects of the post-agricultural inversion of the potassium-to-sodium and base-to-chloride ratios in the human diet. Eur J Nutr. 2001 Oct;40(5):200-13.
- Hoy MK, Goldman JD. Potassium intake of the U.S. population-what we eat in America, NHANES 2009-2010, 2012 https://thepaleodiet.com/sea-salt-devil-deep-blue-sea/
- Cordain” class=”redactor-autoparser-object”>www.ars.usda.gov/ba/bhnrc/fsrg… L. The Real Paleo Diet Cookbook. Houghton, Mifflin, Harcourt, New York, 2015.
- Cordain L. Real Paleo Fast & Easy. Houghton, Mifflin, Harcourt, New York, 2015.
- Cordain L, Stephenson L, Cordain L. The Paleo Diet Cookbook. John Wiley & Sons, New York, 2011.
- Cordain L. The nutritional characteristics of a contemporary diet based upon Paleolithic food groups. J Am Neutraceut Assoc 2002; 5:15-24.
- Cordain L, Eaton SB, Sebastian A, Mann N, Lindeberg S, Watkins BA, O’Keefe JH, Brand-Miller J. Origins and evolution of the western diet: Health implications for the 21st century. Am J Clin Nutr 2005; 81:341-54.
- Cao JJ, Nielsen FH. Acid diet (high-meat protein) effects on calcium metabolism and bone health. Curr Opin Clin Nutr Metab Care. 2010 Nov;13(6):698-702.
- Remer T, Manz F. Potential renal acid load of foods and its influence on urine pH. J Am Diet Assoc 1995;95: 791–7.
- Frassetto L., Todd K., Morris R., Sebastian A. Estimation of net endogenous noncarbonic acid production in humans from diet potassium and protein contents. Am. J. Clin. Nutr. 1998;68: 576–583
- Dawson-Hughes B, Harris SS, Ceglia L. Alkaline diets favor lean tissue mass in older adults. Am J Clin Nutr. 2008 Mar;87(3):662-5
- Lee-Kwan SH, Moore LV, Blanck HM, Harris DM, Galuska, D. Disparities in State-specific adult fruit and vegetable consumption — United States, 2015. Morbidity and Mortality Weekly Report (MMWR), 66(45);1241–1247; November 17, 2017. https://www.cdc.gov/mmwr/volumes/66/wr/mm6645a1.htm?s_cid=mm6645a1_w
- Lemann J Jr. Relationship between urinary calcium and net acid excretion as determined by dietary protein and potassium: a review. Nephron 1999;81:18-25)
- Wang Y., Moss J. Predictors of body surface area. J. Clin. Anaesth. 1992;4:4–10.
- Carr AJ, Sharma AP, Ross ML, Welvaert M, Slater GJ, Burke LM. Chronic ketogenic low carbohydrate high fat diet has minimal effects on acid-base status in elite athletes. Nutrients. 2018 Feb 18;10(2). pii: E236.
- Yancy WS Jr, Olsen MK, Dudley T, Westman EC. Acid-base analysis of individuals following two weight loss diets. Eur J Clin Nutr. 2007 Dec;61(12):1416-22
- Byrne AL, Bennett M, Chatterji R, Symons R, Pace NL, Thomas PS. Peripheral venous and arterial blood gas analysis in adults: are they comparable? A systematic review and meta-analysis. Respirology. 2014 Feb;19(2):168-175.
- Gomez-Arbelaez D, Crujeiras AB, Castro AI, Goday A, Mas-Lorenzo A, Bellon A, Tejera C, Bellido D, Galban C, Sajoux I, Lopez-Jaramillo P, Casanueva FF. Acid-base safety during the course of a very low-calorie-ketogenic diet. Endocrine. 2017 Oct;58(1):81-90
- Macdonald HM, New SA, Fraser WD, Campbell MK, Reid DM. Low dietary potassium intakes and high dietary estimates of net endogenous acid production are associated with low bone mineral density in premenopausal women and increased markers of bone resorption in postmenopausal women. Am J Clin Nutr. 2005 Apr;81(4):923-33
- New SA, MacDonald HM, Campbell MK, Martin JC, Garton MJ, Robins SP, Reid DM. Lower estimates of net endogenous non-carbonic acid production are positively associated with indexes of bone health in premenopausal and perimenopausal women. Am J Clin Nutr. 2004 Jan;79(1):131-8
- Wynn E, Krieg MA, Lanham-New SA, Burckhardt P. Postgraduate Symposium: Positive influence of nutritional alkalinity on bone health. Proc Nutr Soc. 2010 Feb;69(1):166-73.
- Willi SM, Oexmann MJ, Wright NM, Collop NA, Key LL Jr. The effects of a high-protein, low-fat, ketogenic diet on adolescents with morbid obesity: body composition, blood chemistries, and sleep abnormalities. Pediatrics. 1998 Jan;101(1 Pt 1):61-7.
- Skov AR, Haulrik N, Toubro S, Mølgaard C, Astrup A. Effect of protein intake on bone mineralization during weight loss: a 6-month trial. Obes Res. 2002 Jun;10(6):432-8.
- Caso G, Garlick PJ. Control of muscle protein kinetics by acid-base balance. Curr Opin Clin Nutr Metab Care. 2005 Jan;8(1):73-6
- May RC, Bailey JL, Mitch WE, Masud T, England BK. Glucocorticoids and acidosis stimulate protein and amino acid catabolism in vivo. Kidney Int. 1996 Mar;49(3):679-83.
- Reaich D, Channon SM, Scrimgeour CM, Goodship TH. Ammonium chloride-induced acidosis increases protein breakdown and amino acid oxidation in humans. Am J Physiol. 1992 Oct;263(4 Pt 1):E735-9.
- Reaich D, Channon SM, Scrimgeour CM, Daley SE, Wilkinson R, Goodship TH. Correction of acidosis in humans with CRF decreases protein degradation and amino acid oxidation. Am J Physiol. 1993 Aug;265(2 Pt 1): E230-5
- Frassetto L, Banerjee T, Powe N, Sebastian A. Acid balance, dietary acid load, and bone effects-A controversial subject. Nutrients. 2018 Apr 21;10(4). pii: E517.
- Roughead ZK, Johnson LK, Lykken GI, Hunt JR. Controlled high meat diets do not affect calcium retention or indices of bone status in healthy postmenopausal women. J Nutr. 2003 Apr;133(4):1020-6
- Sinclair HM. Diet of Canadian Indians and Eskimos. Proc Nutr Soc, 1953;12: 69-82.
- Lindeberg, S. Osteoporosis in 20th century Eskimos. PALEODIET Digest, Listserve. July 29, 1997
- Mazess RB, Mather W. Bone mineral content of North Alaskan Eskimos. Am J Clin Nutr. 1974 Sep;27(9):916-25.
- Pawson IG. Radiographic determination of excessive bone loss in Alaskan Eskimos. Hum Biol. 1974 Sep;46(3):369-80.
- Mazess RB, Mather WE. Bone mineral content in Canadian Eskimos. Hum Biol. 1975 Feb;47(1):44-63.
- Harper AB, Laughlin WS, Mazess RB. Bone mineral content in St. Lawrence Island Eskimos. Hum Biol. 1984 Feb;56(1):63-78.
- Massey LK1, Whiting SJ. Dietary salt, urinary calcium, and bone loss. J Bone Miner Res. 1996 Jun;11(6):731-6.
- Park SM, Jee J, Joung JY et al. High dietary sodium intake assessed by 24-hour urine specimen increase urinary calcium excretion and bone resorption marker. J Bone Metab. 2014 Aug;21(3):189-94.
- Park SM, Joung JY, Cho YY et al. Effect of high dietary sodium on bone turnover markers and urinary calcium excretion in Korean postmenopausal women with low bone mass. Eur J Clin Nutr. 2015 Mar;69(3):361-6
- Goulding A, McParland BE. Fasting and 24-h urinary sodium/creatinine values in young and elderly women on low-salt and salt-supplemented regimens. J Cardiovasc Pharmacol. 1990;16 Suppl 7:S47-9
- Fatahi S, Namazi N, Larijani B, Azadbakht L. The association of dietary and urinary sodium with bone mineral density and risk of osteoporosis: A Systematic Review and Meta-Analysis. J Am Coll Nutr. 2018 Apr 4:1-11
- Kwon SJ, Ha YC, Park Y. High dietary sodium intake is associated with low bone mass in postmenopausal women: Korea National Health and Nutrition Examination Survey, 2008-2011. Osteoporos Int. 2017 Apr;28(4):1445-1452
- Kim Y, Kim HY, Kim JH. Associations between reported dietary sodium intake and osteoporosis in Korean postmenopausal women: The 2008-2011 Korea National Health and Nutrition Examination Survey. Asia Pac J Public Health. 2017 Jul;29(5):430-439
- Frassetto LA, Morris RC Jr, Sellmeyer DE, Sebastian A. Adverse effects of sodium chloride on bone in the aging human population resulting from habitual consumption of typical American diets. J Nutr. 2008 Feb;138(2):419S-422S.
- Harrington M, Cashman KD. High salt intake appears to increase bone resorption in postmenopausal women but high potassium intake ameliorates this adverse effect. Nutr Rev. 2003 May;61(5 Pt 1):179-83.
- Larsson SC, Orsini N, Wolk A. Dietary magnesium intake and risk of stroke: a meta-analysis of prospective studies. Am J Clin Nutr. 2012 Feb;95(2):362-6
- Rebholz CM, Tin A, Liu Y, Kuczmarski MF, Evans MK, Zonderman AB, Crews DC. Dietary Magnesium and Kidney Function Decline: The Healthy Aging in Neighborhoods of Diversity across the Life Span Study. Am J Nephrol. 2016;44(5):381-387
- Shah NC, Shah GJ, Li Z, Jiang XC, Altura BT, Altura BM. Short-term magnesium deficiency downregulates telomerase, upregulates neutral sphingomyelinase and induces oxidative DNA damage in cardiovascular tissues: relevance to atherogenesis, cardiovascular diseases and aging. Int J Clin Exp Med. 2014 Mar 15;7(3):497-514
- Del Gobbo LC, Imamura F, Wu JH, de Oliveira Otto MC, Chiuve SE, Mozaffarian D. Circulating and dietary magnesium and risk of cardiovascular disease: a systematic review and meta-analysis of prospective studies. Am J Clin Nutr. 2013 Jul;98(1):160-73
- Zhang X, Xia J, Del Gobbo LC, Hruby A, Dai Q, Song Y. Serum magnesium concentrations and all-cause, cardiovascular, and cancer mortality among U.S. adults: Results from the NHANES I Epidemiologic Follow-up Study. Clin Nutr. 2017 Aug 30. pii: S0261-5614(17)30304-7
- Wu J, Xun P, Tang Q, Cai W, He K. Circulating magnesium levels and incidence of coronary heart diseases, hypertension, and type 2 diabetes mellitus: a meta-analysis of prospective cohort studies. Nutr J. 2017 Sep 19;16(1):60. doi: 10.1186/s12937-017-0280-3
- Rosanoff A, Dai Q, Shapses SA. Essential Nutrient Interactions: Does Low or Suboptimal Magnesium Status Interact with Vitamin D and/or Calcium Status? Adv Nutr. 2016 Jan 15;7(1):25-43
- Seelig MS. Increased need for magnesium with the use of combined oestrogen and calcium for osteoporosis treatment. Magnes Res. 1990 Sep;3(3):197-215.
- Park B, Kim MH, Cha CK, Lee YJ, Kim KC. High calcium-magnesium ratio in hair is associated with coronary artery calcification in middle-aged and elderly individuals. Biol Trace Elem Res. 2017 Sep;179(1):52-58
- Kousa A, Havulinna AS, Moltchanova E, Taskinen O, Nikkarinen M, Eriksson J, Karvonen M. Calcium:magnesium ratio in local groundwater and incidence of acute myocardial infarction among males in rural Finland. Environ Health Perspect. 2006 May;114(5):730-4.
- Sato H, Takeuchi Y, Matsuda K, Saito A, Kagaya S, Fukami H, Ojima Y, Nagasawa T. Evaluation of the predictive value of the serum calcium-magnesium ratio for all-cause and cardiovascular mortality in incident dialysis patients. Cardiorenal Med. 2017 Dec;8(1):50-60
- Varo P. Minerl element balance and coronary heart disease. Int J Vitam Nutr Res. 1974;44:367-73.
- Wang ZM, Zhou B, Nie ZL et al. Folate and risk of coronary heart disease: a meta-analysis of prospective studies. Nutr Metab Cardiovasc Dis. 2012 Oct;22(10):890-9.
- Voutilainen S, Rissanen TH, Virtanen J, Lakka TA, Salonen JT; Kuopio Ischemic Heart Disease Risk Factor Study. Low dietary folate intake is associated with an excess incidence of acute coronary events: The Kuopio Ischemic Heart Disease Risk Factor Study. Circulation. 2001 Jun 5;103(22):2674-80
- Qin X, Li J, Spence JD et al. Folic acid therapy reduces the first stroke risk associated with hypercholesterolemia among hypertensive patients. Stroke. 2016 Nov;47(11):2805-2812.
- Odewole OA1, Williamson RS, Zakai NA, Berry RJ, Judd SE, Qi YP, Adedinsewo DA, Oakley GP Jr. Near-elimination of folate-deficiency anemia by mandatory folic acid fortification in older US adults: Reasons for Geographic and Racial Differences in Stroke study 2003-2007. Am J Clin Nutr. 2013 Oct;98(4):1042-7.
- Zhang D, Wen X, Wu W, Guo Y, Cui W. Elevated homocysteine level and folate deficiency associated with increased overall risk of carcinogenesis: meta-analysis of 83 case-control studies involving 35,758 individuals. PLoS One. 2015 May 18;10(5):e0123423. doi: 10.1371/journal.pone.0123423.
- Lin HL, An QZ, Wang QZ, Liu CX. Folate intake and pancreatic cancer risk: an overall and dose-response meta-analysis. Public Health. 2013 Jul;127(7):607-13.
- Zhou X, Meng Y. Association between serum folate level and cervical cancer: a meta-analysis. Arch Gynecol Obstet. 2016 Apr;293(4):871-7.
- Koike H, Takahashi M, Ohyama K et al. Clinicopathologic features of folate-deficiency neuropathy. Neurology. 2015 Mar 10;84(10):1026-33.
- Naderi N, House JD. Recent developments in folate nutrition. Adv Food Nutr Res. 2018; 83:195-213.
- Granger M, Eck P. Dietary Vitamin C in Human Health. Adv Food Nutr Res. 2018; 83:281-310.
- Malmir H, Shab-Bidar S, Djafarian K. Vitamin C intake in relation to bone mineral density and risk of hip fracture and osteoporosis: a systematic review and meta-analysis of observational studies. Br J Nutr. 2018 Apr;119(8):847-858.
- Sun Y, Liu C, Bo Y et al. Dietary vitamin C intake and the risk of hip fracture: a dose-response meta-analysis. Osteoporos Int. 2018 Jan;29(1):79-87. doi: 10.1007/s00198-017-4284-9. Epub 2017 Nov 3.
- Bo Y, Lu Y, Zhao Y et al. Association between dietary vitamin C intake and risk of esophageal cancer: A dose-response meta-analysis. Int J Cancer. 2016 Apr 15;138(8):1843-50.
- Luo J, Shen L, Zheng D. Association between vitamin C intake and lung cancer: a dose-response meta-analysis. Sci Rep. 2014 Aug 22; 4:6161. doi: 10.1038/srep06161.
- Harris HR, Orsini N, Wolk A. Vitamin C and survival among women with breast cancer: a meta-analysis. Eur J Cancer. 2014 May;50(7):1223-31. doi: 10.1016/j.ejca.2014.02.013. Epub 2014 Mar 7.
- Chen GC, Lu DB, Pang Z, Liu QF. Vitamin C intake, circulating vitamin C and risk of stroke: a meta-analysis of prospective studies. J Am Heart Assoc. 2013 Nov 27;2(6):e000329. doi: 10.1161/JAHA.113.000329.
- Nei M, Ngo L2 Sirven JI, Sperling MR. Ketogenic diet in adolescents and adults with epilepsy. Seizure. 2014 Jun;23(6):439-42.
Loren Cordain, Ph.D.
As a professor at Colorado State University, Dr. Loren Cordain developed The Paleo Diet® through decades of research and collaboration with fellow scientists around the world.
More About The Author
Health Benefits and Prevention


The Paleo Diet® Newsletter
Sign up to get info on healthy nutrition, free recipes, meal prepping, and the latest health research. New subscribers will also receive our Official Paleo Grocery List!